On maps
I can’t get anywhere without Google Maps. In the office, we scribble things on whiteboards. Without realising it, we use maps all the time and are natural cartographers. Maps can be many things with different shapes and applications. What is a map, and why do we rely on them so often? Let’s explore how they work, how we use them and how they serve us.
What makes a map a map
When we think about a map, road maps or geographical maps come up, but a map can be many things.
A map is a symbolic depiction emphasising the relationship between elements of some space, such as objects, regions, or themes. (Wikipedia)
There are no expectations of the shape and content of a map. A map can be diagrammatic (e.g. a map with arrows and numbers) or simply depicting something (e.g. a museum map). Is a diagram a map? I say yes in most situations. A bar chart or a Gantt chart can be considered maps as they depict relationships between objects.
Maps are graphic representations that facilitate a spatial understanding of things, concepts, conditions, processes, or events in the human world (J. B. Harley & D. Woodward (eds), The history of cartography, vol. 1, 1987, p. xvi)
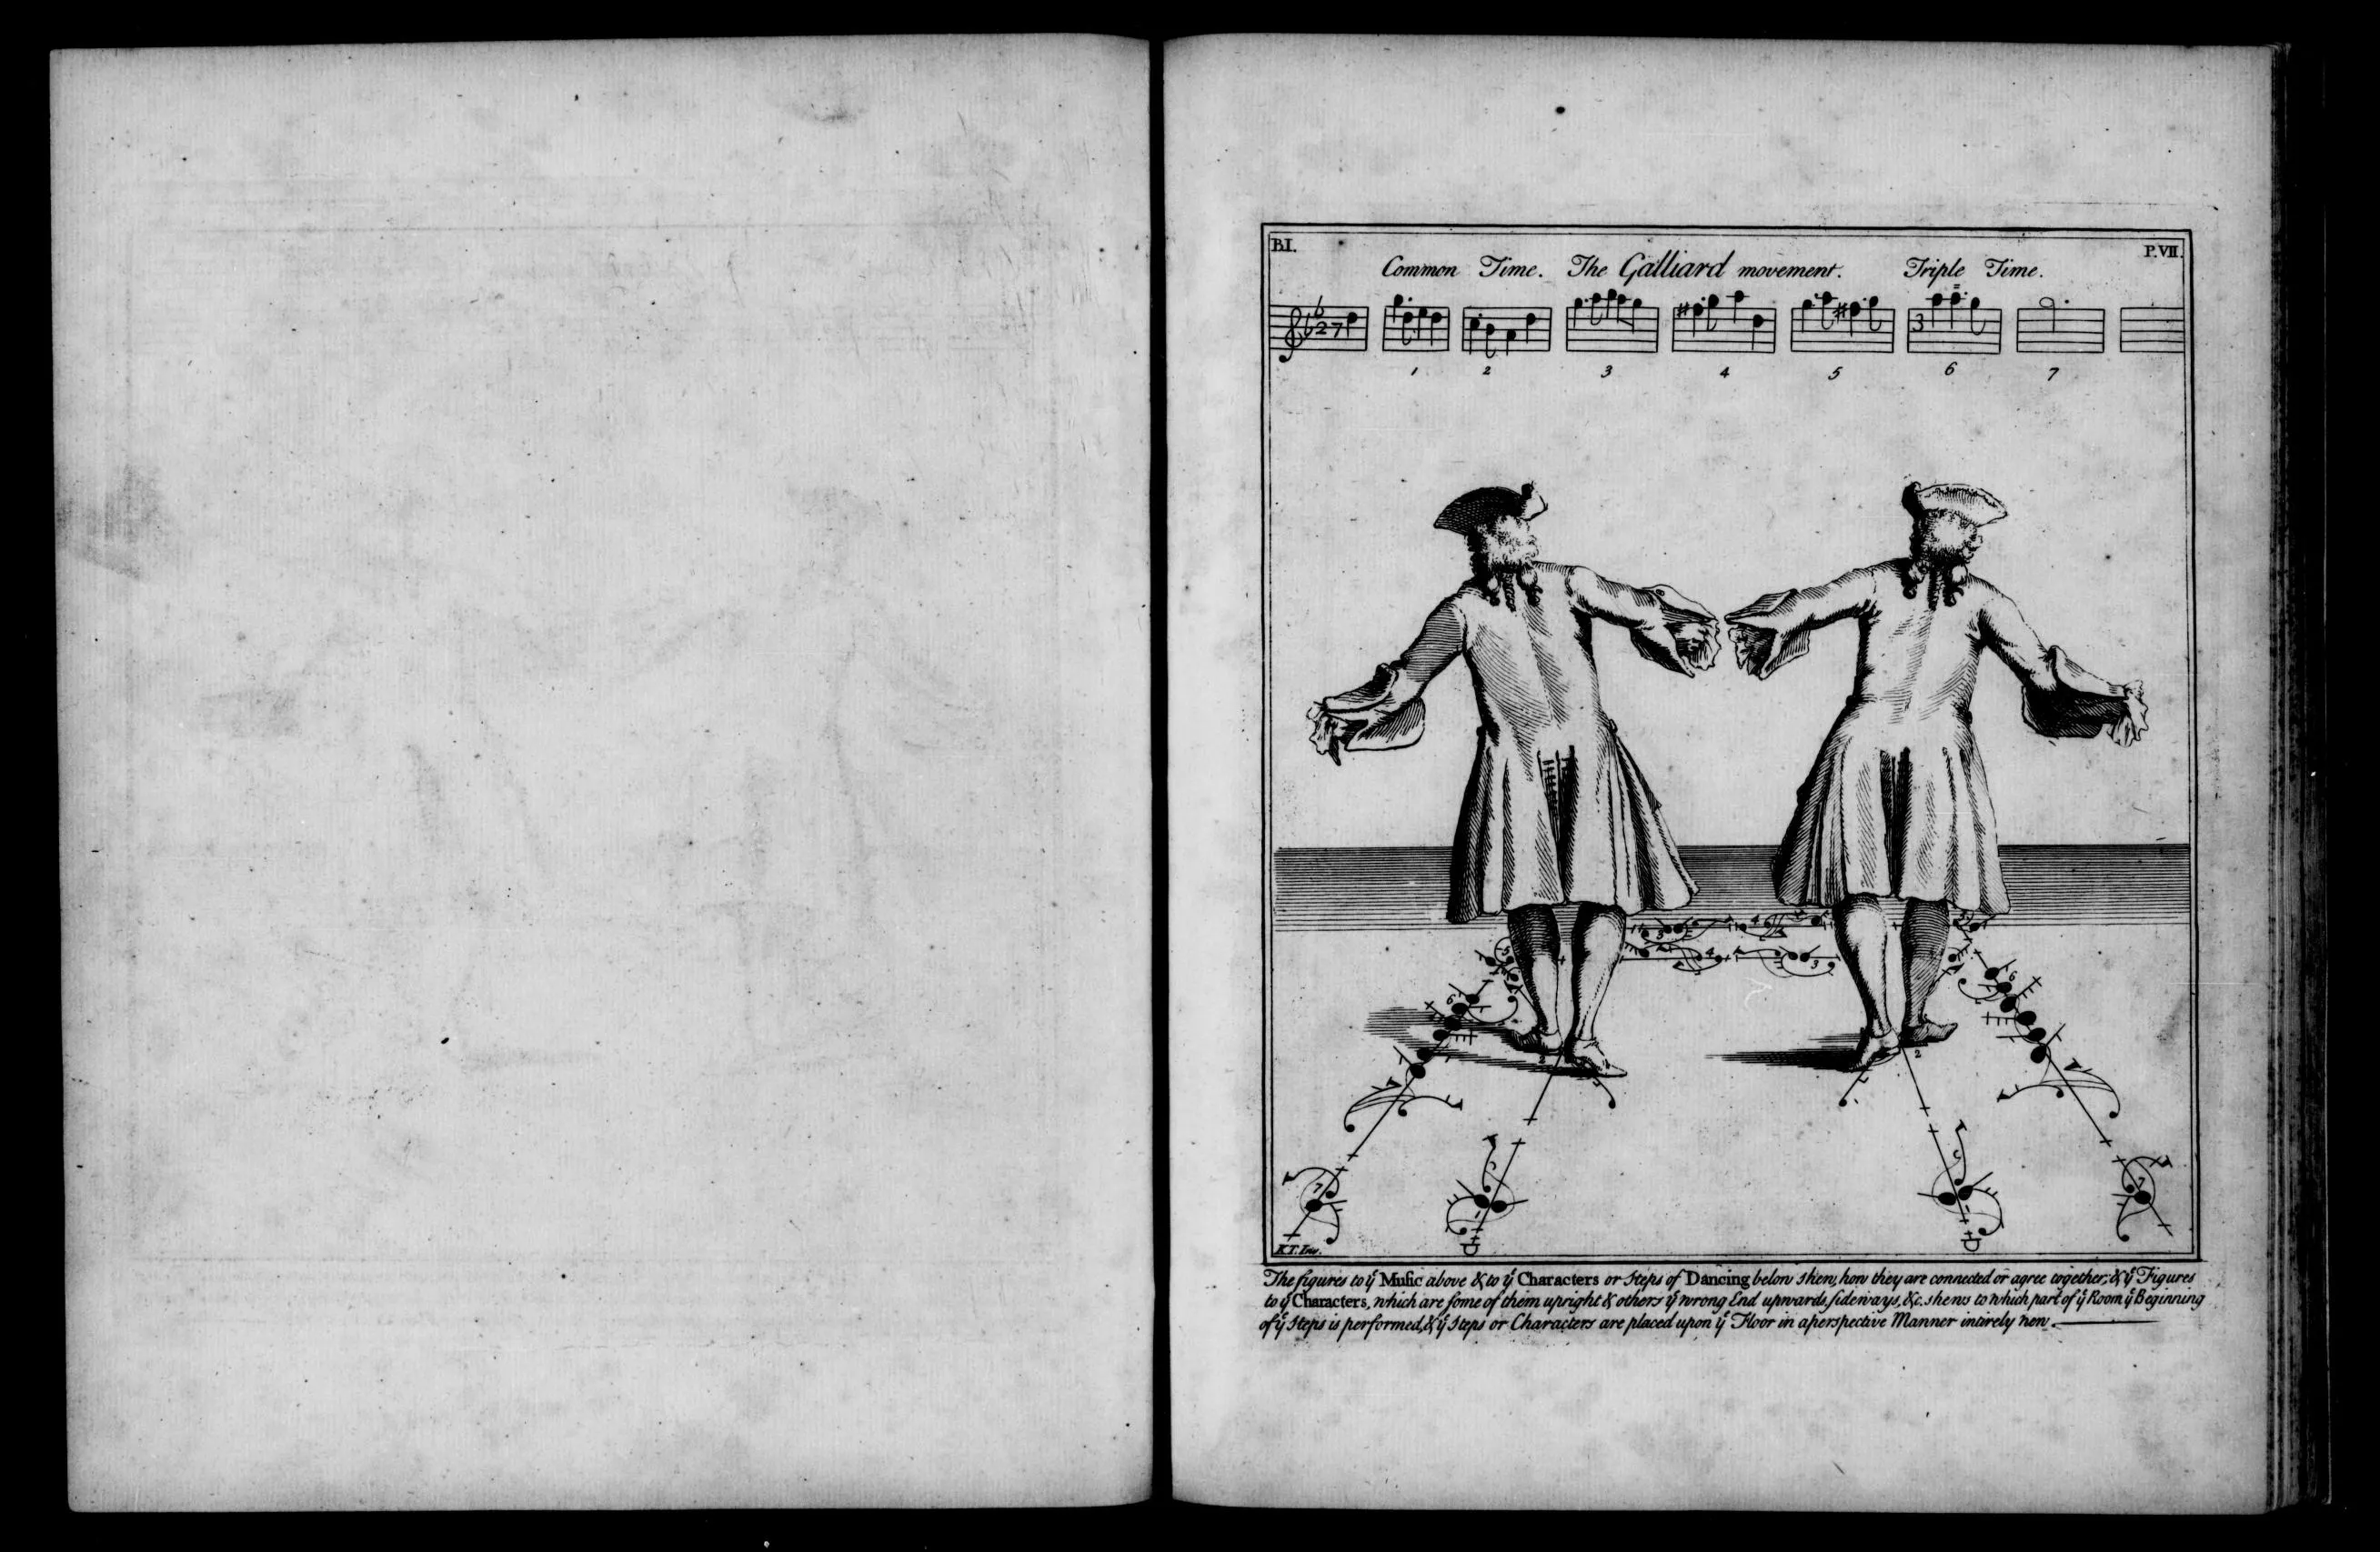
The art of dancing explained by reading and figures1
A map is a communication tool that helps make sense of our environment and situation with the provided information, context, and orientation. A map highlights spatial, temporal, and causal correlations using multiple dimensions. It delivers information efficiently in a clear, precise, ethical (sometimes) way.
A map is a utilitarian tool. Although some maps use fanciful gimmicks, the ultimate goal of using a map is to make sense of a situation and find the shortest or most rewarding path or idea.
- A map is for getting somewhere
- A map is for cataloguing, curating, referencing and putting subjects in a context
- A map is for interrogating
- A map is set in a time frame (a map to understand the past, a map to understand the future)
- A map can show progress and steps with a temporal axis
How to read a map
As a medium, we read maps in different modes : read, write or read and write. You read a road map to get somewhere but don’t usually alter it. On the contrary, a mind map is in a read-and-write mode; while reading, you add more things to it as your understanding and ideas about a subject flourish.
We consume maps differently at different stages and alternate between modes :
- writing, creating and editing
- viewing, reading and interpreting
- finding solutions, ideas and connecting
| Organising | Finding | Presenting | Interpreting | Showing progress |
| Path making | Path finding | Decision making | Comparing | Argumentation |
| Showing difference | Showing relations | Cataloguing | Ideating | Contrasting |
| Curating | Referencing | Interrogating | Finding solutions | Understanding |
| Proving | Demonstrating | Orientating | Connecting | Showing steps |
| Chaining | Clustering | Grouping | Separating | Indicating |
Precautions
Maps are an approximation of reality and an interpretation of raw data. They can be dangerous when their authors introduce bias and errors of judgment. Indeed the map is not the territory. Maps are also set in time and can become outdated or portray defunct ideologies.
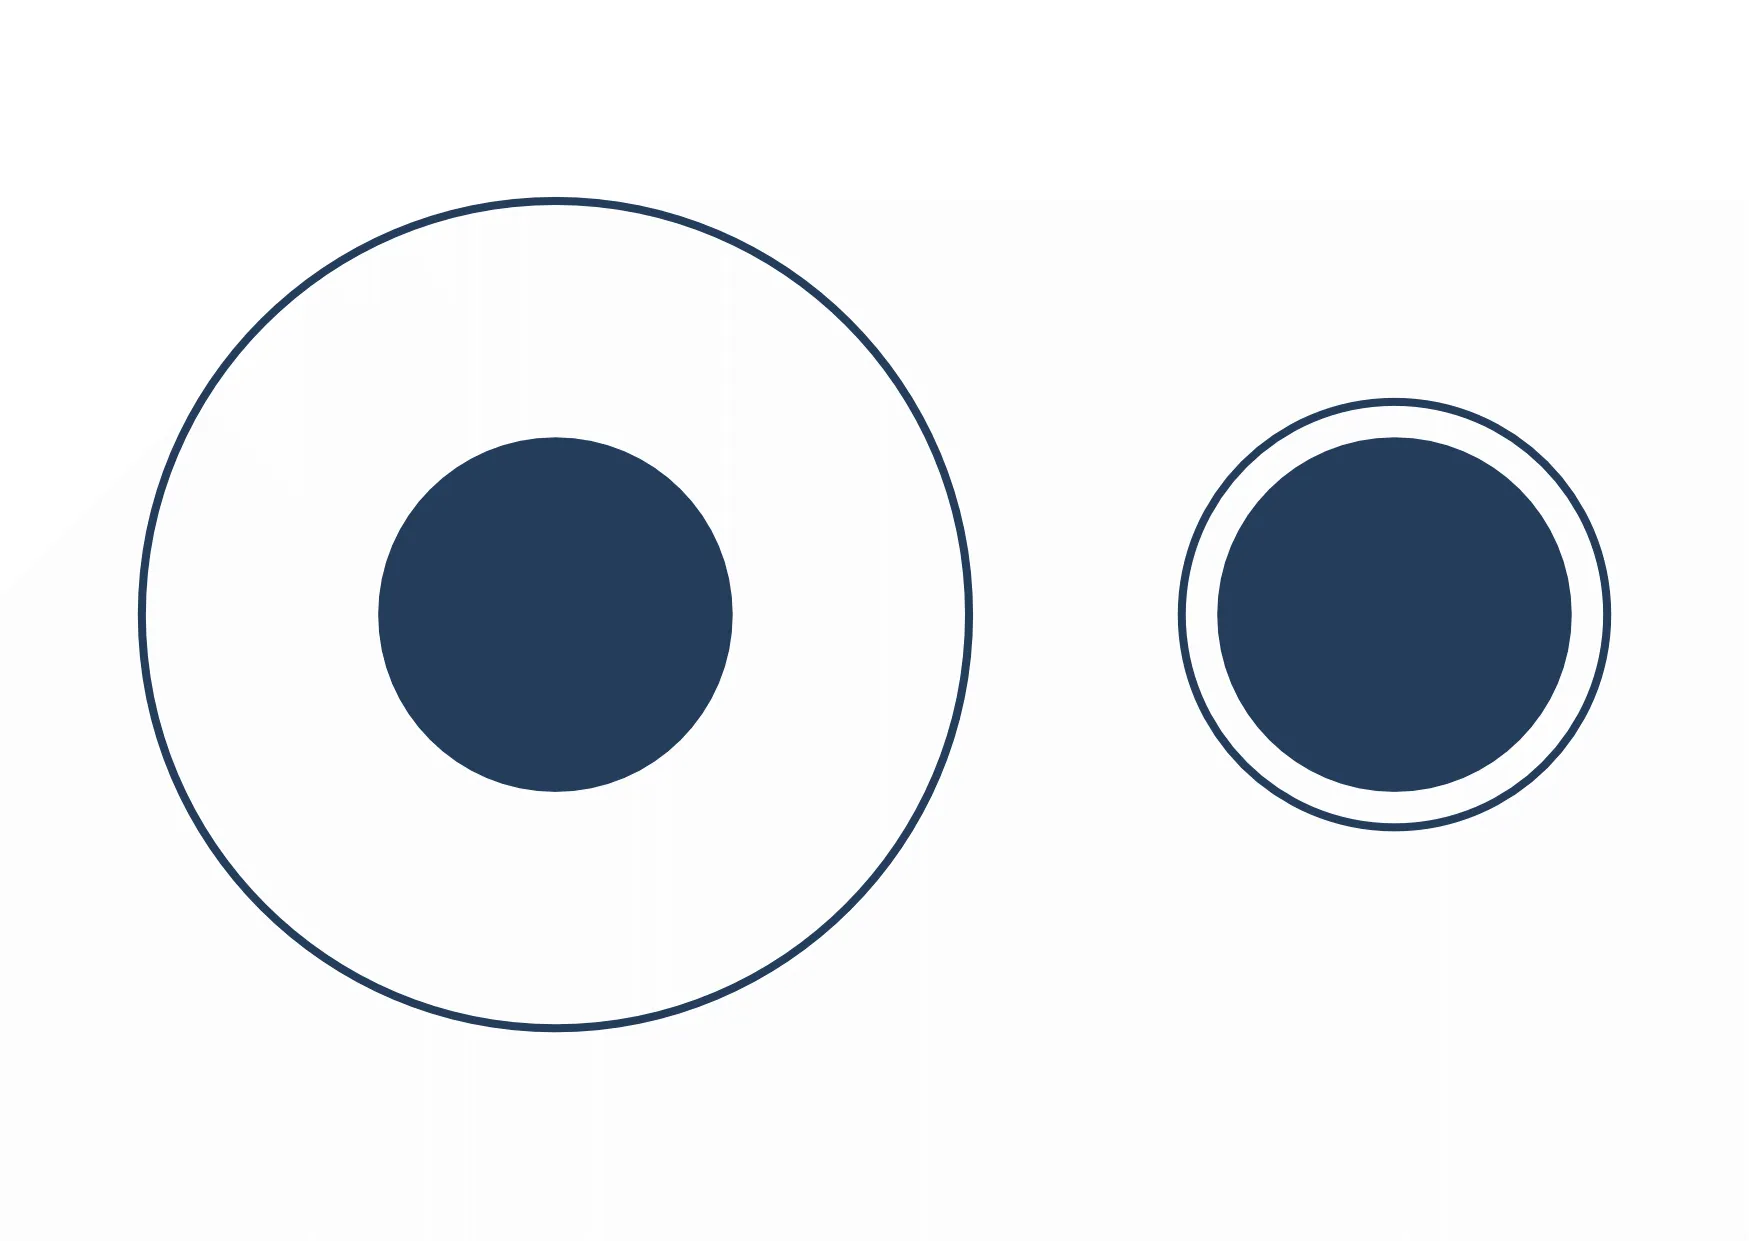
Moreover, diagrammatic reasoning is a powerful tool. But only some people are good at visual thinking, and the diagram’s author can shape it to serve a particular perverted goal. A map can accidentally omit some critical information or have a scope that is too narrow to understand the whole depicted situation. The Ebbinghaus illusion or the Delboeuf illusion shows how we are easily fooled; we think in relative but are not so great at thinking in absolute or seeing the big picture.

Maps in action
We can use simpler and well-known ideas and patterns to understand complex concepts. The book a Pattern Language simplifies the enormous task of designing space for life, home and cities by devising a multitude of simple patterns. Mapping helps us break down concepts; while we create a map and simplify insights, we also develop and deepen our understanding.
Mapping is used in a multitude of contexts and domains. It’s a tool for exchanging information and knowledge, telling a story and helping us reflect on information using different lenses and points of view.
A cartographer has to understand the following:
- Who is the audience of the map
- What is the intended use and purpose
Creativity
Creativity is all about creating a connection between unrelated things. It’s also about finding answers to a design problem or a question. It is no wonder that maps are an excellent tool for creativity.
Mind maps and concept maps are popular mapping techniques. A concept map is a visual diagram that depicts suggested relationships between concepts. They are similar in that a mind map has only one central concept, while a concept map may have several. A mind map is a hierarchical tree structure, while a concept map is a graph.
Concept maps can demonstrate how people visualise relationships between various concepts. This example shows multiple ways in which St. Nicolas (as a protagonist) might be understood.
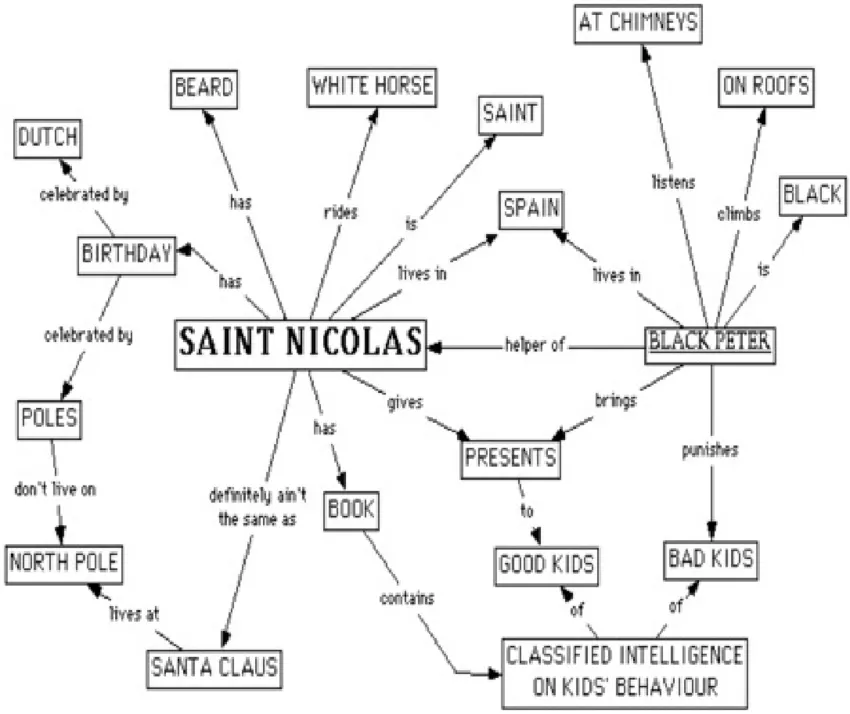
Framing Experience: Concept Maps, Mind Maps, and Data Collection in Qualitative Research 2
Sense-making
Sense-making is closely related to creativity. In movies, crime solvers use a map to see the invisible. They map the connections between the protagonist and victims using a red thread.
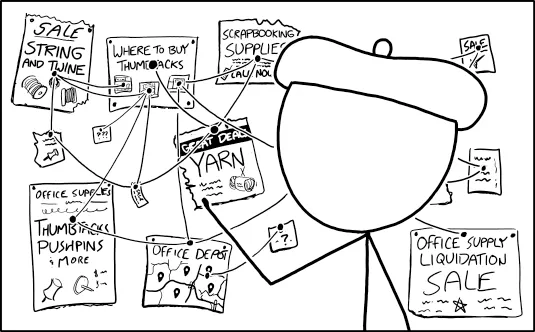
Thumbtacks And String, xkcd 2244
Map creation is an exercise for discovering, learning about a subject and decision-making. The action of intricately understanding something often leads to having creative ideas about the studied subject.
John Snow, at the time, creatively solved the Broad Street cholera outbreak puzzle by mapping cases leading to the discovery of the cause.
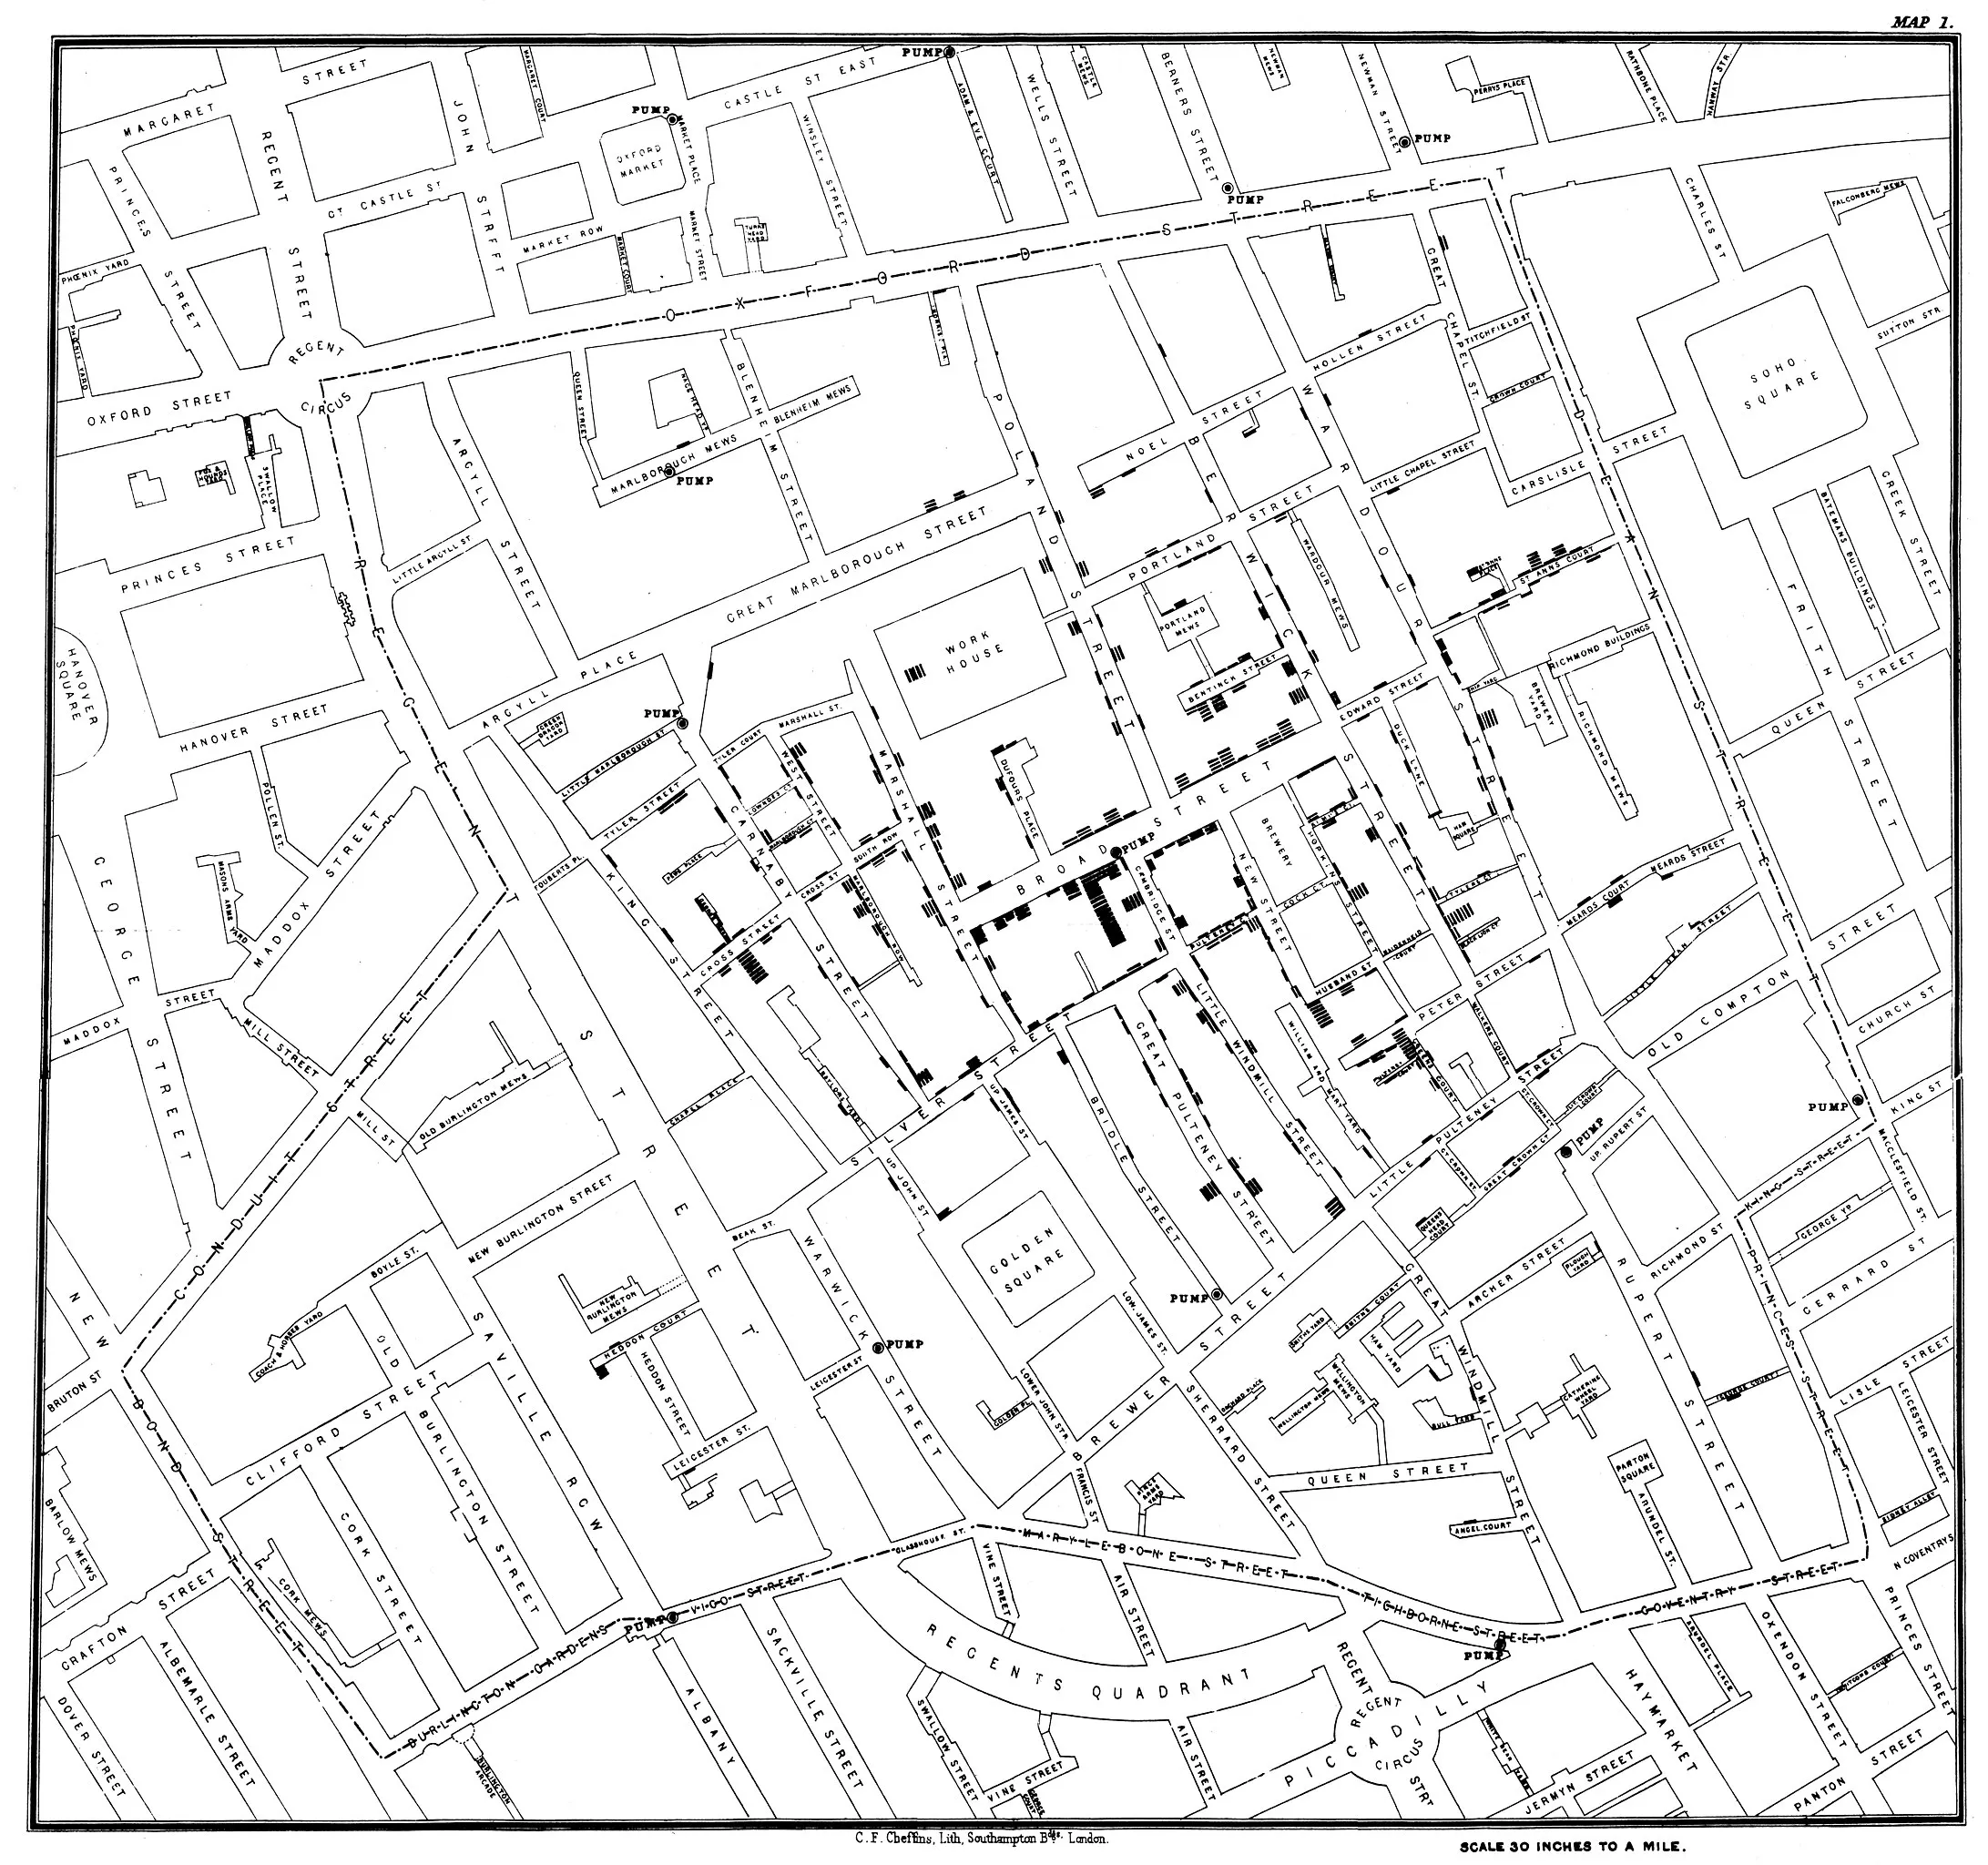
Cholera cases are highlighted in black, showing the clusters of cholera cases (indicated by stacked rectangles) in the London epidemic of 1854. From Wikipedia.
Maps are heavily used in business. In a constantly evolving complex environment, a map gives orientation and informs strategy and tactics. The famous consultant matrix appears in many forms. Take, for example, the impact-effort matrix, the Eisenhower or the BCG matrix. It’s so simple; a square divided into two axes. The form is simple; filling the squares is hard, and consultants make a lot of money from it. They are all staple product management tools that help taking decisions in uncertainty. Most of the products and services you use must have something to do with one of those matrixes.
The Business Model Canvas and Lean canvas are maps helping startups find clarity in what they offer to the world. Wardley maps are another type of mapping to make sense of organisations, products and services. They help make the knowledge and processes of an organisation explicit.
Those examples are used to make sense, tell stories, and convince investors and the general public. This is another important aspect of mapping.
Story-telling
Authors use maps to plan intricate stories. When should a character appear? When should this information be revealed? All the answers to these questions can be plotted to have a better bird’s eye view of the scenario. See, for example, Joseph Heller’s handwritten outline for Catch-22 or J.K. Rowling’s handwritten spreadsheet for Harry Potter.
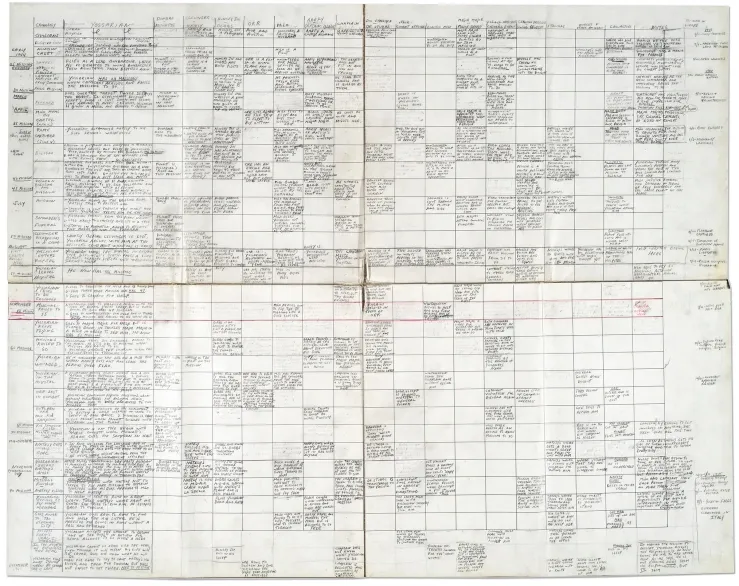
Hand-drawn spreadsheet of Catch-22 structure and chronology. Via
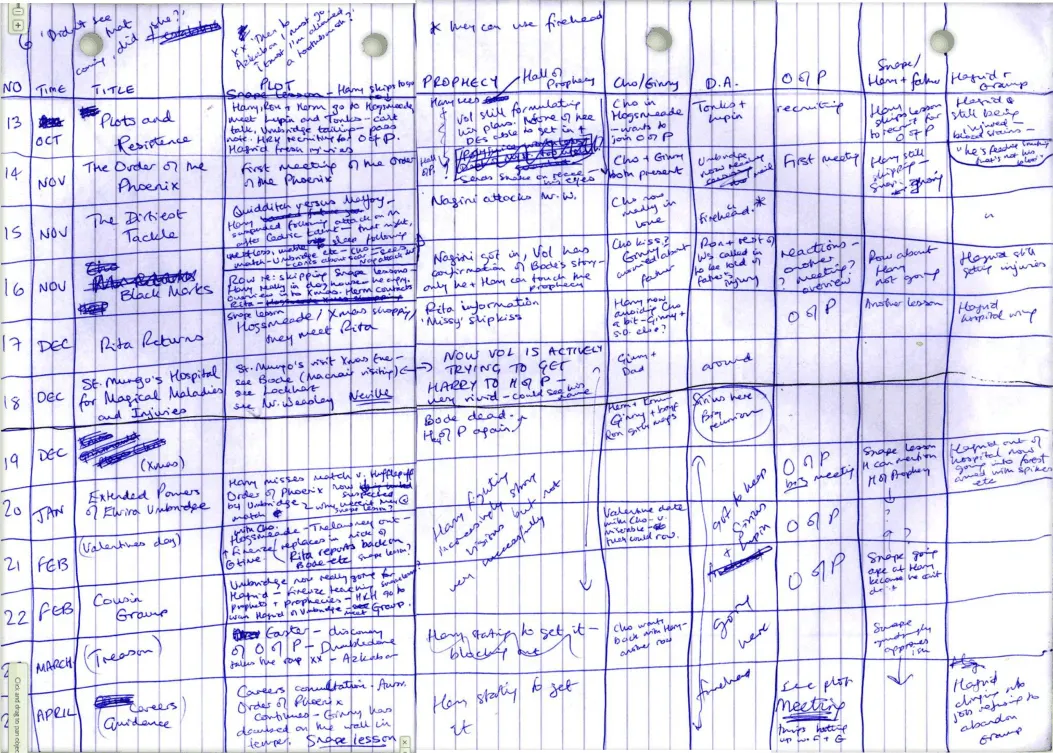
Hand-drawn spreadsheet of the plot of some chapters in a Harry Potter book. Via
In The Lord of The Rings 3, fictional maps help the reader anchor the story and enhance world-building.
History is story-telling. This fantastic figurative map by Charles Joseph Minard shows Napoleon’s invasion of Russia in 1812.
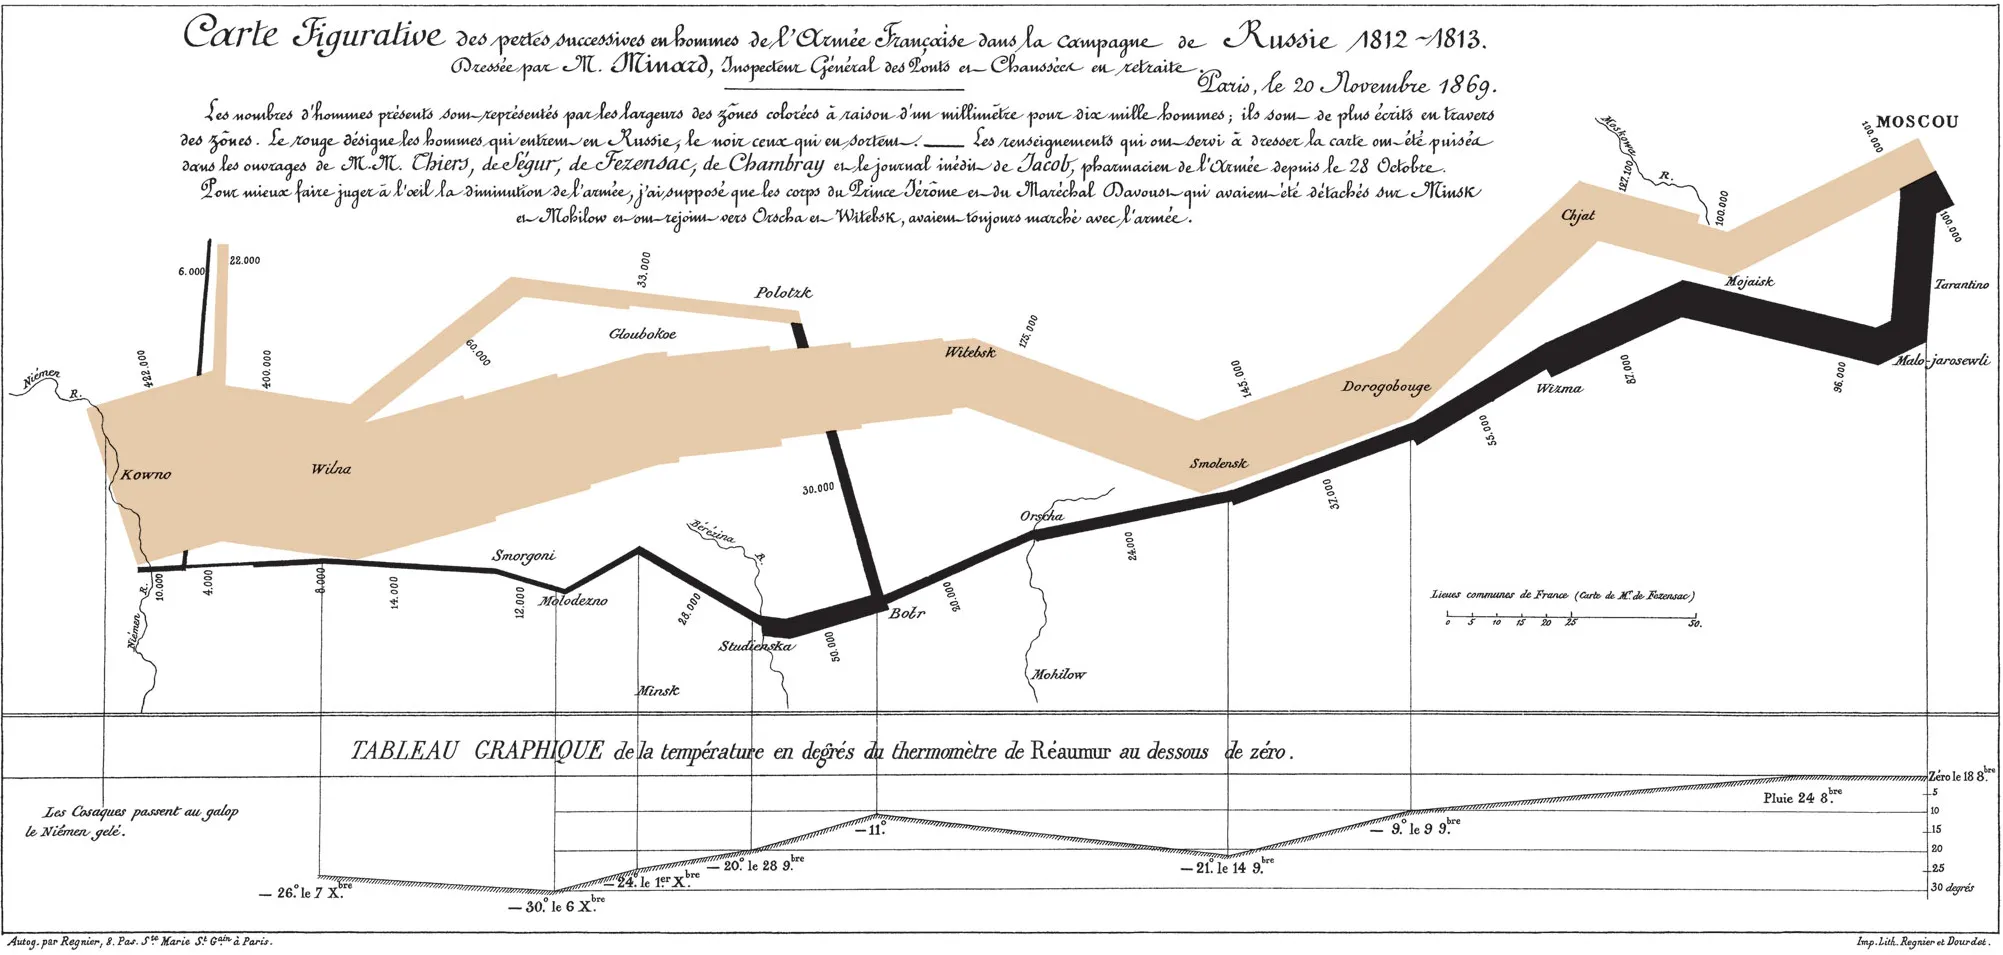
The map of Napoleon’s Russian campaign. Via
Time prediction is a story too. A story we tell customers and stakeholders to appease their impatience. Gantt charts are popular in business to show the dependencies and tasks in a project. They help find out the critical path of a project which lists tasks that causes a lot of dependencies. Other popular styles are the flow chart and the journey map. They are great for showing business processes or what someone has to perform.
Way-finding
The obvious application of mapping is representing physical places. Maps present information and characteristics about the world in a symbolic, visual way. They let us understand the world by showing the sizes and shapes of countries, elevation, and distances between places. Maps can show the location of buildings, roads and points of interest.
Cartography is the art, science, and technology of map-making. A lot of choices have to be made by cartographers as to how to represent reality with some fidelity.
Maps are models of reality reproduced at a convenient size. Things that you can usually fing on a map :
- Projection
- Scale (usually some text or a graphical bar scale)
- Symbols
- Grid
- Legend
First, the spherical surface of the Earth is transferred to a flat surface using a projection. Projection is a major topic for cartographers because every technique comes with distortions.
The scale informs you of the actual size.
Symbols are used to represent things. A legend at the bottom of the map will explain how to use symbols. A symbol can be a colour; for example, using blue to denote rivers, lakes and oceans. Some maps show relief, or changes in elevation with contour lines, also called topographic lines, which connect points of equal height.
A grid is overlayed on the map to help locate things. This grid usually shows latitude and longitude lines and the equator.
Finally, a legend usually mentions the title, authors and describes the map’s purpose.
Cartographers have some techniques to simplify reality. For example, notable buildings can be bigger than streets, or a park could be summarised with a green-coloured area. Individual houses could be amalgamated into one block. Sometimes using generalisation techniques has some advantages.
The London Tube map is an excellent example where bypassing physical reality improves the ease of use of a map. Earlier versions displayed the train lines according to geography.
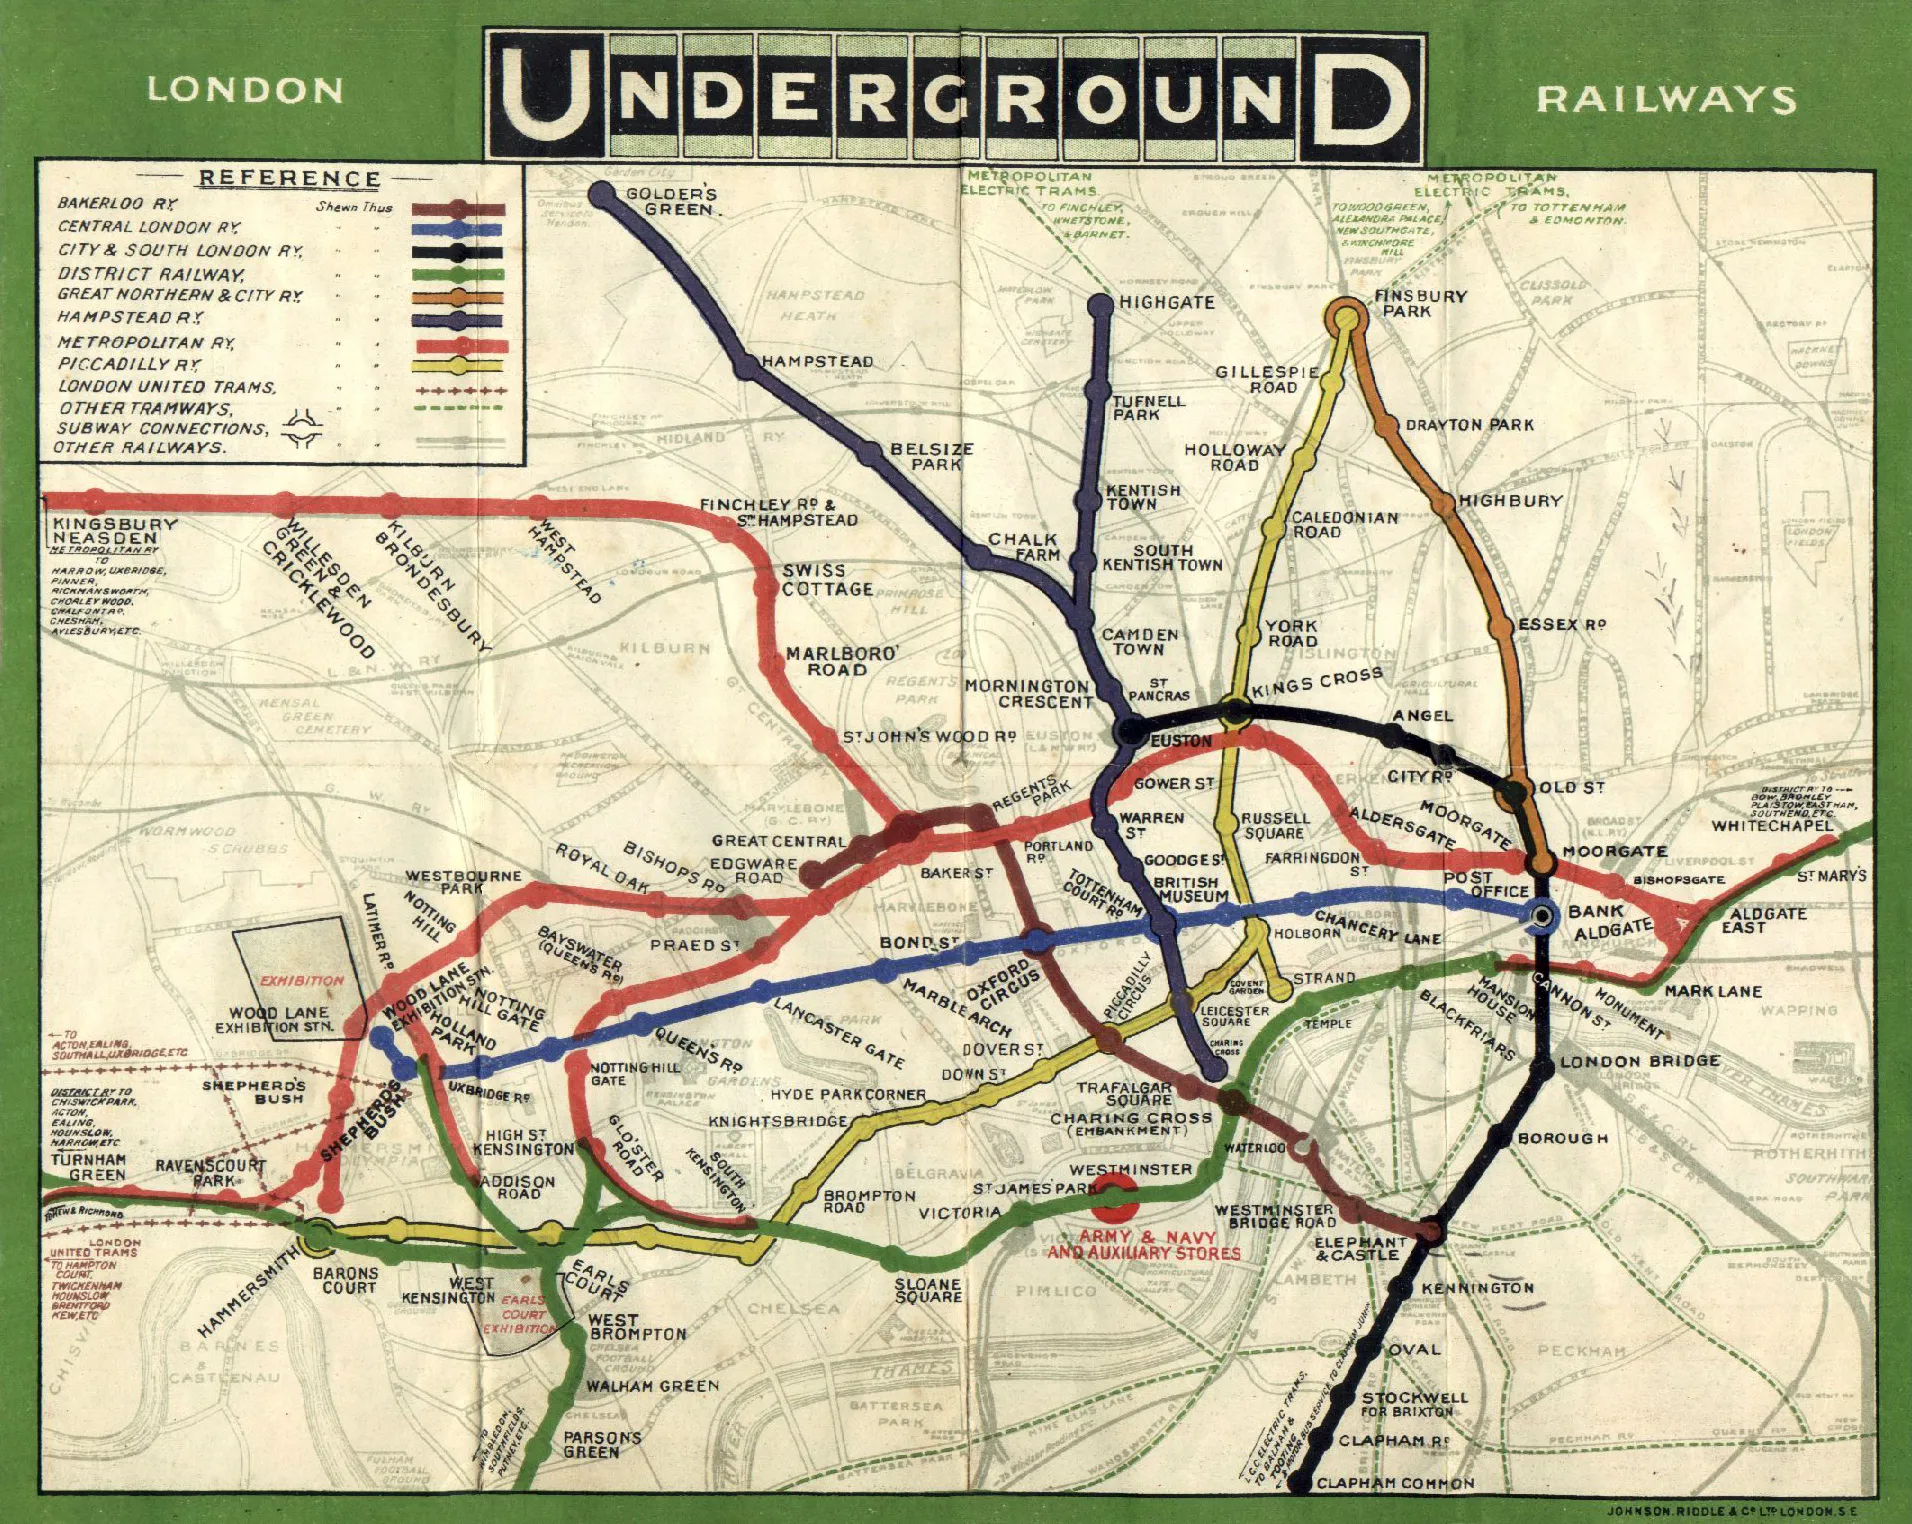
London Underground map in 1908. Via
At some point, the engineer Harry Beck worked, in his spare time, on an improved version that distorted reality. There was no coming back. The map was far easier to read.
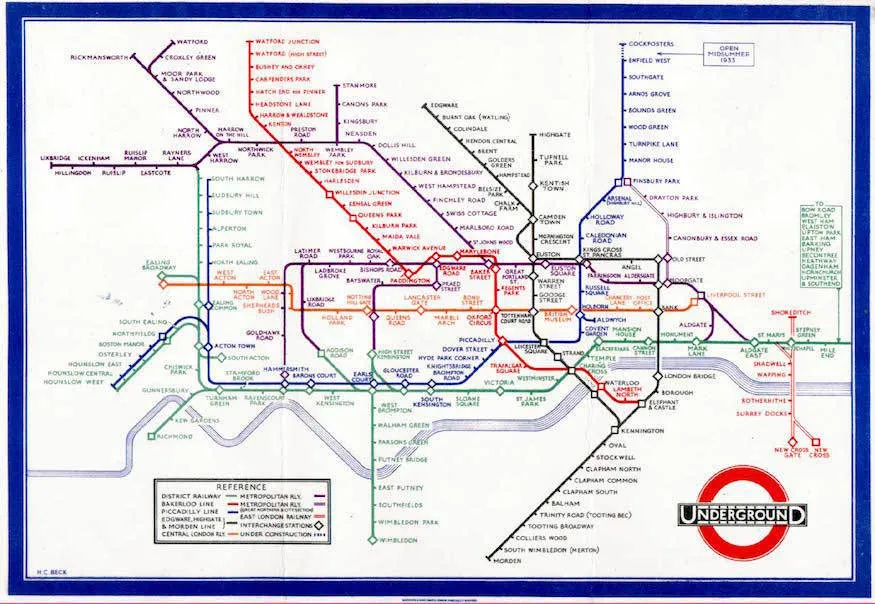
Beck’s concept for a better London Underground map in 1933. Via
Conclusion
Maps are everywhere, and mapping is an essential tool for designing and problem-solving. A map tells a story that lets us understand a subject and communicate our ideas to the world. Maps help us locate the unknown, define limits of the known, and help plan where to start, where to go first and to track where we’ve been. Should we make more maps in our lives? Can we use maps as a tool to take decisions, achieve goals and inspire us? I encourage you to become a cartographer and make your own personal maps, whether they are simple mood boards, mind maps, codified techniques or something of your invention.
Appendix
Recommended reading
- Visual Explanations: Images and Quantities, Evidence and Narrative
- What is cartography
- Framing Experience: Concept Maps, Mind Maps, and Data Collection in Qualitative Research
Footnotes
-
Tomlinson, Kellom. The art of dancing is explained by reading and figures, whereby the manner of performing the steps is made easy by a new and familiar method: being the original work, first designed in the year, and now published by Kellom Tomlinson, dancing-master … In two books. [London: Printed for the author, M.DCC.XXXV, 1735] Pdf. https://www.loc.gov/item/20010870/.] ↩
-
Scientific Figure on ResearchGate. Available from: https://www.researchgate.net/figure/Exemplar-concept-map-of-St-Nicolas_fig3_261772908 [accessed 12 Dec, 2022] ↩